Products
Solutions
Resources
9977 N 90th Street, Suite 250 Scottsdale, AZ 85258 | 1-800-637-7496
© 2024 InEight, Inc. All Rights Reserved | Privacy Statement | Terms of Service | Cookie Policy | Do not sell/share my information

When a schedule is ready for production, schedulers can move to the Short Interval Planning (SIP) view to begin planning out the day-to-day tasks involved with completing scheduled activities. This type of planning can be done in intervals of 17, 25, and 50 days based on a selected interval.
To open the Short Interval Planning view, go to the project navigation menu and select Short Interval Planning from the list.
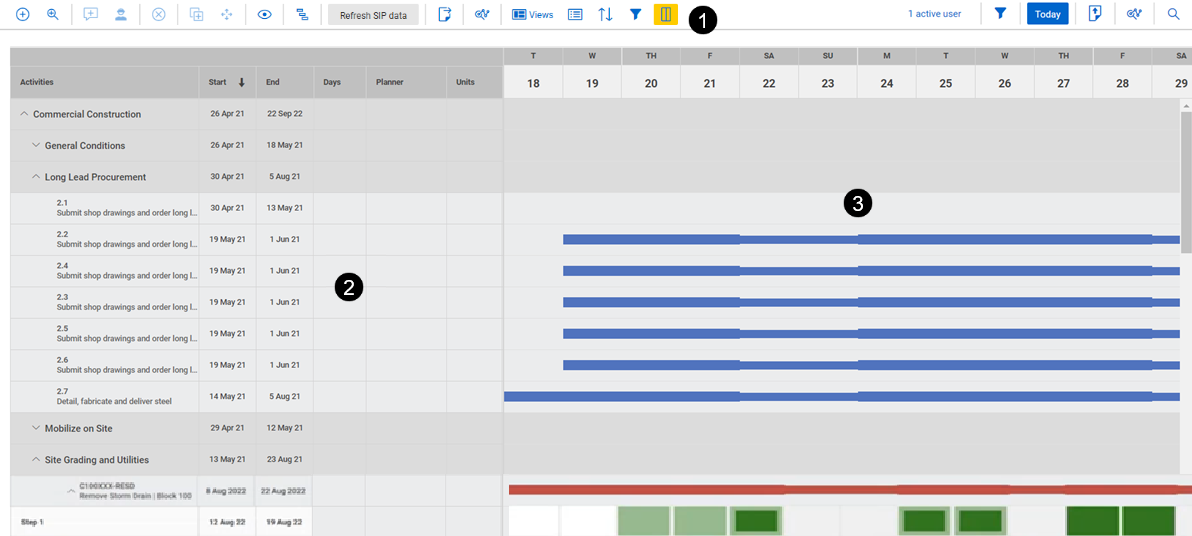
In the SIP view there are three primary sections:
| 1 | Toolbar | Contains view adjustment settings such as, filtering, grouping, annotations, and date range. |
| 2 | Activities | Work package and activity structure are brought in from the Plan view. Tasks are further broken out in the SIP view. |
| 3 | Calendar | Shows a segment, or interval, of the schedule based on settings in the toolbar. |
The toolbar shows SIP step and action icons, view options, and other functions.

The SIP step action icons show enabled in the toolbar when you are actively in a step.
| Description | Function |
|---|---|
| Add step | Adds a step under the selected activity. |
| Zoom to start | Moves the Gantt chart to show one day prior to the step start date. |
| Add comment | Opens a dialog box where you can type text and save a comment for the step. |
| Add SIP resource | Opens the Add SIP Resource dialog box where you can select and assign an existing SIP resource for the task. Add values for units or quantities to track progress at a granular level. |
| Remove step | Deletes the selected step. |
| Copy | Opens a dialog box that lets you copy the selected step or steps into other activities. |
| Snap To | Lets you select multiple steps in an activity and move them to new dates while maintaining the relationship relative to the initial step in the activity. |
The SIP functions include Builder Menus with SIP view variations that have similar functionality to those in other Schedule views.
| Description | Function |
|---|---|
| View options |
Select metrics, view row numbers, annotations, color coding for the view, and resource histogram. |
| Detail level | Select the level of detail shown in the Activities section. |
| Refresh SIP data | Click to update the view with the latest changes. |
| Export | Exports the current view to an Excel spreadsheet. |
| Zoom level | Sets the date range interval shown in the calendar. |
| Views |
Use column filters to group and sort, then save as a view. Can also use templates and View builder. By default, the SIP Units/Qty and Row Numbers toggles are set to On. |
| Group By | Allows you to see activities grouped together based on the option selected. This functionality provides flexibility to schedulers and execution planners in how they want to organize and assess tasks, resource utilization, and activity progress. You can also group activities and tasks by codes when knowledge tags are used on the project. |
| Sort | Filters the columns according to the parameters selected. |
| Filter | Opens the filter function to set parameters for the activities and tasks that show in the view. |
| Column Set | Allows you to add and remove columns to customize the view. Column sets can be saved and reused. |
| Search | Search and find a specific task or step. |
The SIP resource histogram lets you perform resource management at a short-term plan level that gives you another level of granularity when analyzing resources. The SIP resource histogram shows the assigned SIP resources for the project with functionality like the Plan view resource histogram. In SIP view, click the View options icon. Under Resources, select Histogram to show SIP planned units in the view. In the Status drop-down list, you choose additional SIP data to show in the histogram.

In the Activities section, Schedule activities from the CPM are shown. Each of these activities can be broken into steps or tasks for more detail when planning field execution.
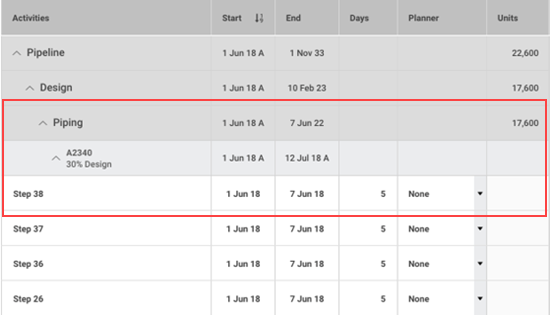
Planning packages and activities are shown in a hierarchy. Planning packages group activities the same way as in the CPM schedule. Each activity line shows a planned start date, end date, activity ID, and the activity description.
When steps are defined, they show as a subordinate of the activity. An overview of the step details are noted that includes, start date, end date, duration, planner, and quantity.
In the SIP step, you can track progress of a resource for the task. Values can be edited directly in the step and depending on the field that is changed they are calculated as follows:
SIP Planned Units/Qty – Values entered are spread evenly across all days.
SIP Actual Units/Qty – Values entered are spread evenly across all days prior to current day.
SIP Remaining Units/Qty – Values entered are spread evenly across days after current day.
SIP At Complete Units/Qty – Shows the value entered. Use to adjust for a forecast that is greater than the budgeted value in SIP Planned Units/Qty.
SIP Units/Qty % Complete – Updates both actual and remaining units. The percentage shown is value of (SIP Planned Units/Qty - SIP Remaining Units/Qty) ÷ SIP Planned Units/Qty.
SIP Duration % Complete – Shows the percentage calculated value of the number of SIP dates prior to current day ÷ total number of SIP steps.
Use the column chooser to select the SIP Units/Qty columns you want to show.

When the SIP Units/Qty toggle is enabled, the Show Planned Unit toggle also shows. Set the Show Planned Unit toggle to On to show planned units in the (past) activity segments that are prior to today’s date.
You also have the option to track actuals at a more granular level if needed. Click the Add SIP resource icon and enter values for the specific dates.

Select rows in an activity to copy, and then click the Copy icon to open the Copy SIP Steps dialog box. In the dialog box, you can select up to ten activities to copy the rows into. You can also choose to remove steps that are selected from the list to be copied.

You can select and move individual activity steps to a new date on the timeline. The Snap To feature lets you select multiple steps in an activity and move them all to new dates, maintaining the relationship relative to the initial step in the activity.
After you select the steps to move in the activity, click the Snap To icon to open the dialog box. Click in the Snap to Start Date field to open the calendar, and then select the new start date for the initial step. In the Include column, use the toggle to add or remove steps to move.
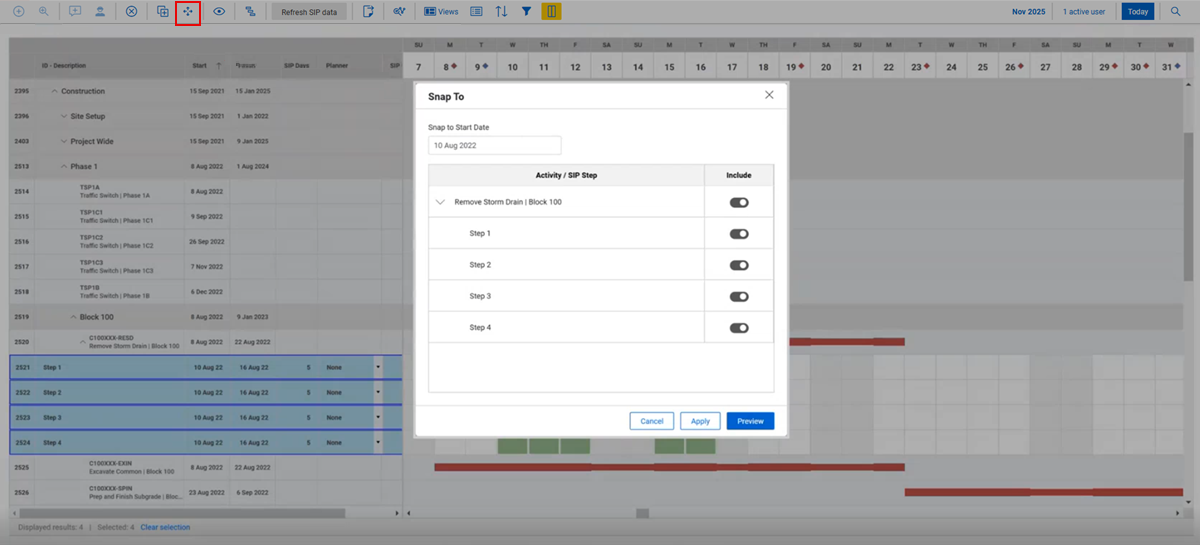
After selecting the new start date, click Preview to show an overlay of the steps with the new start date. You can save the changes in the preview or click Back to close the preview and open the dialog box again to make additional changes as needed.

Click the Zoom level icon in the toolbar and select the calendar date range of the SIP view header to 3 weeks, 30 days or 60 days. In the calendar there are two primary indicators, the blue and red CPM schedule activity bars, and the colored step bars.
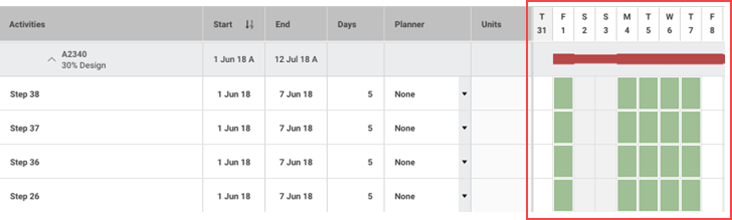
The blue and red CPM schedule activity bars represent working days and non-working days. The thicker segments indicate working days in the activity’s calendar and thinner segments are non-working days.
The colored bars in the step indicate the days that work is being done for the activity. As a Planner, you can click and drag the bars along the timeline to adjust the start date and end date of the step and add or delete days for the step.
Schedule has built in functionality to pull in weather data when a project location has been set up in Project Settings > Project configuration. When this function is setup, the weather shows in the date column header for the current day and a forecast for the next seven days.

Click the Weather icon to open the selected day’s weather forecast. This data is powered by Open Weather.
Additional Information
9977 N 90th Street, Suite 250 Scottsdale, AZ 85258 | 1-800-637-7496
© 2024 InEight, Inc. All Rights Reserved | Privacy Statement | Terms of Service | Cookie Policy | Do not sell/share my information